As I continue my adventures in machine learning through the FastAI courses, I wanted to explore the concept of dropout rate. If you would like to see the Jupyter Notebook used for these tests, including full annotations about what/why, check out my machine learning github project. Specifically the Testing Dropout Rates (small images).ipynb.
Really quickly, dropout rate is a method in Convolutional Neural Networks (CNNs) of removing neurons (e.g. in the first layer of an image this would be individual pixels) to prevent overfitting (i.e. doing notably better on the training set than on the validation set) and thus increase the general applicability of the model. In other words, block a percentage of the material to force it to not become to overdependent on repeating patterns that lead it astray.
These tests were setup to isolate dropout rate as much as possible. Also, while this test was using ResNet50, results may differ using a different model. Okay, enough jibber-jabber, let’s jump right to the conclusions, shall we?
Learning Rate
The best learning rate needs to be smaller when the dropout rate increases. However, the effect is quite minor and playing it safe with a smaller learning rate goes a long way.
Image Sizes
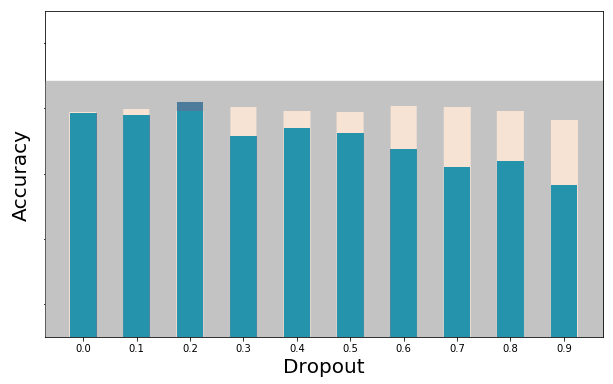
For speed purposes, the smaller the better. I compared 64×64 scaled images to 224×224 scaled images (from the same data set) with appropriate batch sizes and learning rates and found the results were the same, but the place to look for the results changed. For larger images, the clearest differences between dropout rates were in the loss function. For smaller images, accuracy was the best differentiator. Those outputs are the recommended way to distinguish the best dropout rate.
Here’s a collection of images to help make the point clear. Note that bigger is better for accuracy, while smaller is better for loss.
Accuracy
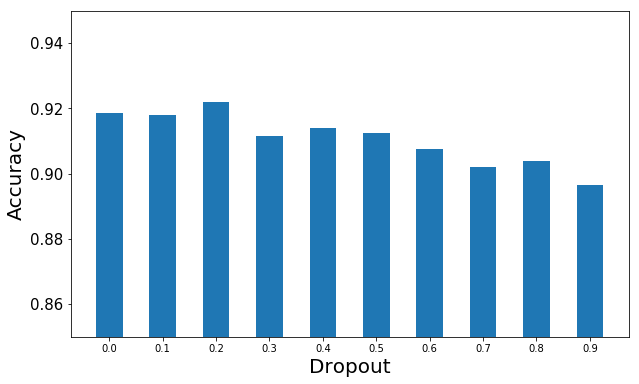
Small Image Accuracy
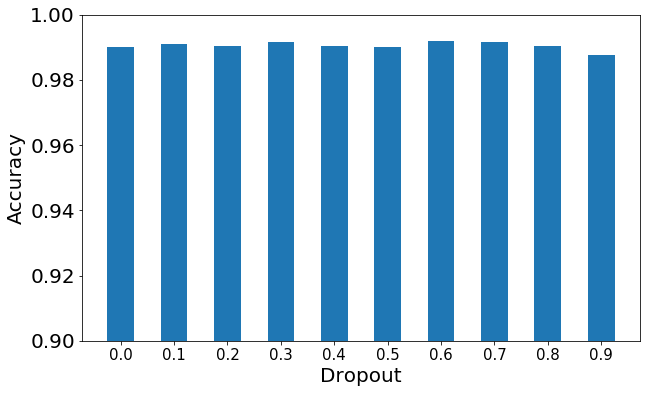
Large Image Accuracy
Loss
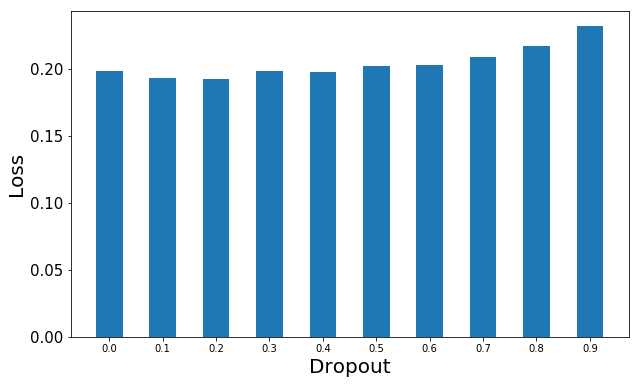
Small Image Loss
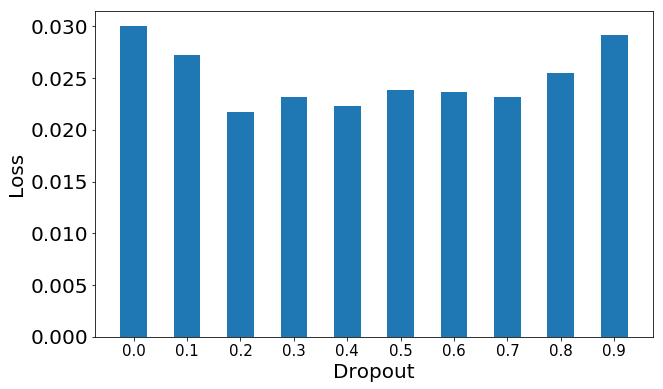
Large Image Loss
Data Sets are Unique
For my data sets, dogs vs cats, there are only two possibilities. And specific to this set, an overall dropout rate of 0.2 was the sweet spot. That will vary, so it’s a great idea to set up a test like my notebook to help determine the best one for your data set. If there are 100 categories, or if it’s a non-vision data set, maybe 0.5 is better. We don’t know until we test, so use the fastest methods possible and see what’s right for you.
Dropouts in Specific Layers
I also have a notebook available to test differences for dropout rates in specific layers. The data here is even more nuanced, but there are a few conclusions I can draw from this one test.
- Using larger dropout rates in early layers will cripple your accuracy.
- A quick rule-of-thumb in 2 layers of dropouts (ResNet) is to use 1/2 the dropout rate for the first layer than you use for the second layer (e.g. [0.1,0.2] or [0.25,0.5])